19 AI Infographic Generators (No Design Skills Required)
Written By
Published On
Read Time

Step into a world where the best AI-powered tools open up limitless possibilities. These tools make it easy to create infographics, stunning art, and personalized images effortlessly. Experience the wonder of AI that can transform your text or photos into playful cartoons, craft engaging tweets, or help write captivating content. Prepare to unleash your creativity, save time, and boost your online presence with these powerful tools. We will explore each tool in detail, highlighting the unique features and benefits they offer. Whether you’re a business owner, a content creator, or just looking to have some fun, our comprehensive guide to the best AI-powered tools has something for everyone.
19 Best AI Infographic Generators
These AI infographic generators not only save time and effort but also offer tailored customization options. Users can easily add images, charts, and other assets to enhance their infographics and make them more visually appealing. The AI technology behind these tools ensures that the generated infographics are of high quality and meet the user's expectations.
Canva
Overview
Canva is a highly versatile graphic design tool that has gained immense popularity for its ease of use and extensive range of features. Recognized widely as an AI-powered platform, Canva simplifies the design process, making it accessible to users of all skill levels. It provides an array of design options, from creating simple graphics to complex infographics and presentations.
Key Features
Template Library: Canva boasts a vast library of pre-designed templates that users can customize. This library includes specific templates for infographics, which are categorized by theme and purpose, making it easy for users to find exactly what they need.
Drag-and-Drop Editor: The intuitive drag-and-drop interface allows users to easily add, remove, and manipulate elements within their design. This feature is pivotal for non-designers who want to create professional-looking infographics without the complexity of traditional design tools.
Collaboration Tools: Canva enables real-time collaboration, allowing teams to work together on projects from different locations. Users can comment, share, and edit designs in a shared workspace.
Extensive Asset Library: Users have access to a wide range of elements, including fonts, icons, images, and illustrations. Many of these assets are free, with additional premium options available through a subscription.
AI-Enhanced Capabilities
Content Generator: Canva integrates AI technology to suggest design layouts and match colors and fonts, based on the content entered by the user. This feature helps in maintaining aesthetic coherence throughout the design.
Background Remover: One of the standout AI tools within Canva is the background remover, which is particularly useful for creating clean and professional-looking visuals.
Ease of Use
Canva is designed to be user-friendly, offering a gentle learning curve. It is equipped with guides and an interactive tutorial system that helps new users navigate through its functionalities effortlessly.
Applications
Marketing Material: Businesses use Canva to create marketing materials that are visually appealing and aligned with their brand.
Educational Purposes: Educators and students use Canva to produce presentations and educational content that are engaging and informative.
Pricing
Canva Free: $0.00
Canva Pro: $6.00/month for one person
Canva Teams: $4.56/month for one person
Piktochart
Overview
Piktochart is another robust AI infographic generator designed to help users create impactful and visually engaging infographics, presentations, and reports with ease. It stands out for its focus on infographics, offering tailored tools that enhance information visualization.
Key Features
Infographic Templates: Piktochart provides a rich selection of templates specifically designed for different types of infographics, including statistical, informational, and process diagrams.
Intuitive Editor: The platform offers a straightforward editor where elements like text, shapes, icons, and images can be dragged and dropped into place, making the design process smooth and simple.
Customizable Charts: Users can insert and customize charts directly in their designs, with data that can be manually entered or imported from spreadsheets.
AI-Enhanced Capabilities
Smart Template Suggestion: Piktochart uses AI to recommend templates based on the content that the user intends to display. This ensures that the chosen template is optimal for presenting the data effectively.
Color Scheme Selector: The AI also helps in suggesting color schemes that enhance the readability and aesthetic appeal of the infographic.
Ease of Use
Piktochart is focused on making infographic creation as straightforward as possible. It offers educational resources and customer support to assist users in creating high-quality visuals.
Applications
Business Reporting: Many organizations use Piktochart for internal and external reports because it can convert complex data into a clear and understandable format.
Educational Graphics: Teachers and students often turn to Piktochart to create educational infographics that can make learning more interactive and engaging.
Pricing
For Individuals & Businesses:
Free: $0 free forever
Pro: $29 per member/month
Business: $49 per member/month
Enterprise: Custom pricing
For Teachers & Students:
Free: $0 free forever
Education: $39.99 per member, billed annually
Campus: Custom Pricing
For Nonprofit:
Free: $0 free forever
Nonprofit: $60 per member, billed annually
Venngage
Overview
Venngage is renowned for its specialized focus on infographic design, offering a platform that allows both beginners and professionals to create stunning visual content. It is particularly celebrated for its user-friendly interface and a wide array of templates that cater to various informational needs, from marketing data to educational materials.
Key Features
Diverse Template Library: Venngage hosts a comprehensive collection of infographic templates that are easily customizable. These range from informational and data-driven designs to process and comparison infographics.
Intuitive Design Tools: The platform provides drag-and-drop capabilities that make it easy to add, remove, and edit elements in an infographic. This functionality is crucial for users who lack advanced design skills.
Interactivity Features: One of the standout features of Venngage is the ability to create interactive infographics. Users can incorporate elements such as polls, maps, or clickable icons, which can significantly enhance viewer engagement.
Real-time Collaboration: Similar to other modern design tools, Venngage allows multiple users to collaborate on projects. This is especially useful for teams working remotely or in educational settings where group projects are common.
AI-Enhanced Capabilities
Automated Data Visualization: Venngage uses AI to help users visualize complex data through dynamically generated charts and graphs that update as new data is entered.
Smart Content Suggestions: The AI system in Venngage can suggest content modifications and improvements based on best design practices, helping users optimize the readability and impact of their infographics.
Ease of Use
Venngage prioritizes simplicity in its design process, making it accessible to users with minimal graphic design experience. The platform offers extensive support resources, including video tutorials and a responsive customer service team, to assist users in navigating its features.
Applications
Corporate Communication: Businesses frequently utilize Venngage for creating internal and external communication materials, such as annual reports, marketing analysis, and HR communications.
Educational Projects: Educators and students find Venngage beneficial for creating infographics that illustrate complex academic concepts in a visually digestible format.
Pricing
Free: $0
Premium: $10/month/user
Business: $24/month/user
Enterprise: $499/month for 10+ seats
Visme
Overview
Visme is a versatile graphic design tool that excels in creating not only infographics but also presentations, videos, and other visual content. It is distinguished by its robust functionality that supports extensive customization, making it a preferred choice for users looking to create highly tailored and dynamic visuals.
Key Features
Rich Content Library: Visme offers a vast array of templates and design assets, including icons, fonts, and data widgets, which can be customized to fit any branding or style requirement.
Advanced Data Tools: The platform provides sophisticated tools for embedding and visualizing data, including the ability to link charts directly to live data sources. This ensures that the infographics remain updated with the latest data automatically.
Animation and Interactivity: Visme allows users to animate any element within their infographics and to add interactivity, such as pop-ups, to engage viewers more deeply.
Comprehensive Content Management: Visme includes features for managing projects and assets, such as the ability to save and organize designs, reuse custom templates, and maintain brand consistency across multiple projects.
AI-Enhanced Capabilities
Content Generator: Using AI, Visme can generate entire sections of content based on a few inputs from the user, streamlining the design process and ensuring consistency.
Dynamic Data Integration: Visme’s AI facilitates the integration of dynamic data sources, enabling complex data visualizations that are both accurate and up-to-date.
Ease of Use
Although Visme offers advanced features, it maintains a balance between functionality and user-friendliness. New users can quickly become proficient with the tool thanks to educational resources provided directly within the platform.
Applications
Marketing and Business Development: Visme is widely used by marketing teams to create content that captures and conveys business insights visually, from social media graphics to detailed market research presentations.
Education and Training: Its ability to produce educational and training materials that are both informative and engaging makes Visme a valuable tool for educators and corporate trainers alike.
Pricing
Basic: $0
Starter: $12.25/month
Pro: $24.75/month
Enterprise: Custom
BeFunky
Overview
BeFunky is a versatile online photo editing and graphic design tool that distinguishes itself with its comprehensive suite of features that cater to both novice users and seasoned designers. Its easy-to-use interface combined with powerful editing capabilities makes it ideal for creating high-quality infographics, photo projects, and other digital artworks without the need for complex software.
Key Features
Extensive Design Toolkit: BeFunky offers a wide range of tools, including image editing, collage making, and graphic design. This toolkit is particularly rich in features for creating infographics, such as customizable templates, free-form design capabilities, and a vast selection of stock images and icons.
Collage Maker: A standout feature of BeFunky is its Collage Maker, which allows users to mix multiple images into visually appealing layouts — perfect for infographics that need to showcase comparative data or a series of images.
Photo Editor: The integrated photo editor includes advanced functionalities such as background removal, touch-up tools, and effects, all of which can enhance infographic visuals.
Ease of Use With a drag-and-drop interface, BeFunky is designed to be user-friendly, making complex tasks simpler and more accessible to users without prior design experience.
Applications
Marketing Material: Small businesses and marketers often utilize BeFunky to create eye-catching promotional materials, including infographics that highlight product benefits, showcase statistics, or illustrate workflows.
Social Media Content: The ability to quickly edit photos and design graphics makes BeFunky a favorite for social media influencers and managers aiming to maintain a strong visual presence online.
Pricing
Free: $0
Plus: $14.99/month.
Infogram
Overview
Infogram is a data visualization tool that specializes in creating engaging infographics, reports, dashboards, and interactive visual content. It is particularly noted for its emphasis on integrating real-time data, making it a valuable tool for businesses, media outlets, and educational institutions that need to present statistical information in a clear and compelling manner.
Key Features
Data Integration: Infogram excels at integrating with various data sources like CSV files, Google Sheets, and real-time data feeds, allowing for automatic updates of visuals as the underlying data changes.
Wide Range of Templates: The platform provides a diverse range of templates tailored to different types of data presentations, from simple bar charts to complex geographic maps and multi-page reports.
Interactive Visuals: One of Infogram’s core strengths is its ability to create interactive elements in infographics, such as hover effects, tabs, and clickable legends, which enhance user engagement and information retention.
Collaboration Features: Infogram supports team collaboration, enabling multiple users to work on projects simultaneously and share content seamlessly across the organization.
AI-Enhanced Capabilities
Smart Visualization Recommendations: Infogram uses AI to recommend the most effective visual representations based on the type of data provided. This feature helps users select the best charts and layouts to convey their information clearly.
Automated Design Alignment: AI algorithms also assist in ensuring that designs are visually balanced and aesthetically pleasing, adhering to good design principles automatically.
Ease of Use
Infogram is designed to be intuitive, with a focus on minimizing the learning curve associated with data visualization. Its interface guides users through the process of selecting the right templates and tools to effectively communicate their data.
Applications
Business Analytics: Companies use Infogram to transform complex data sets into understandable visuals that can inform decision-making processes.
Educational Tools: Educators incorporate Infogram into lessons to create interactive and informative visuals that enhance learning and student engagement.
Pricing
Basic: Free Forever
Pro: $25/month
Business: $79/month
Team: $179/month
Enterprise: Custom
Snappa
Overview
Snappa is an online graphic design tool optimized for speed and ease of use, making it ideal for marketers, bloggers, and entrepreneurs who need to create high-quality visual content quickly. Its straightforward interface and rich feature set facilitate the rapid creation of graphics for social media, blogs, ads, and more, including infographics.
Key Features
Pre-designed Templates: Snappa offers a variety of professionally designed templates that can be easily customized to suit different themes and needs, including infographics. This feature saves users time and ensures that even those with minimal design skills can produce visually appealing graphics.
High-Resolution Stock Photos: Users have access to a vast library of high-resolution stock photos directly within the platform, which can be used at no additional cost. This integration simplifies the design process and enhances the aesthetic quality of the infographics.
Drag-and-Drop Editor: Snappa’s user-friendly drag-and-drop editor allows for quick modifications and adjustments without the need for extensive graphic design knowledge. Users can add text, change fonts, and adjust colors with just a few clicks.
Customization and Branding: The platform enables users to upload their own assets, such as logos and custom fonts, making it easy to maintain brand consistency across all designs.
Ease of Use
Snappa is designed to be intuitive, allowing users to create and publish graphics in minutes. The platform also offers tutorials and customer support to assist users in making the most of its features.
Applications
Social Media Marketing: Snappa is widely used for creating social media graphics that are optimized for each platform’s specific size requirements.
Blog Graphics: Bloggers utilize Snappa to design featured images and content visuals that enhance the reader's experience and engagement.
Pricing
Free: Free Forever
Pro: $15/month
Team: $30/month
Mind the Graph
Overview
Mind the Graph is a specialized infographic tool designed primarily for scientists, researchers, and academics. It focuses on making complex scientific data accessible and visually engaging through well-designed infographics and scientific posters.
Key Features
Scientifically Accurate Templates: Mind the Graph offers templates and infographic elements that are specifically tailored for scientific content, including charts, diagrams, and illustrations of scientific concepts and equipment.
Extensive Scientific Illustration Library: The platform provides an expansive collection of scientific illustrations, which can be crucial for accurately depicting complex scientific ideas and data.
Customization Tools: Users can customize templates and illustrations to fit their specific research needs, ensuring that the final graphics are both accurate and aligned with scientific standards.
Collaboration Tools: The tool allows for collaboration among team members, which is particularly useful in research settings where multiple contributors may need to provide input on the visual data representation.
AI-Enhanced Capabilities
Data Visualization: While not explicitly stated, tools like Mind the Graph typically employ AI to help in visualizing complex datasets, making it easier for researchers to illustrate their findings in a comprehensible manner.
Ease of Use
Mind the Graph aims to simplify the creation of scientific graphics, offering an interface that is straightforward yet powerful enough to handle specialized content.
Applications
Academic Publications: Researchers use Mind the Graph to enhance the visual impact of their papers or presentations with accurate and compelling infographics.
Educational Materials: Educators in the sciences create diagrams and educational posters that help explain intricate scientific concepts in a more digestible manner.
Pricing
Monthly Plan: 7 days free, then $19/month
Yearly Plan: 7 days free, then $12/month.
Easelly
Overview
Easelly is a web-based tool that provides an intuitive platform for creating and sharing infographics. It is designed with simplicity in mind, aiming to make it easy for anyone, regardless of their graphic design experience, to create clear, compelling infographics that convey information effectively. Easelly is popular among educators, students, business professionals, and marketers who need to communicate complex data visually.
Key Features
User-Friendly Interface: Easelly’s interface is straightforward, allowing users to drag and drop elements into place with minimal effort.
Variety of Templates: The platform offers a range of customizable templates suited to different types of data presentations, from timelines and processes to comparison charts.
Infographic Resume Builder: One of Easelly’s unique offerings is its infographic resume builder, which users can employ to create visually appealing resumes that stand out in the job market.
Interactive Elements: Users can add interactive elements to their infographics, making them more engaging for online audiences.
Ease of Use
Easelly is particularly noted for its simplicity and ease of use, making it accessible even to those with little to no graphic design experience. The platform also offers educational resources to help users maximize their ability to create effective infographics.
Applications
Educational Tools: Teachers and students use Easelly to create educational infographics that simplify complex subjects.
Business Reporting: Companies utilize Easelly to create reports and presentations that make data easy to understand for stakeholders.
Pricing
Student: $2/month
Individual: $4/month
Adobe Creative Cloud Express (formerly Adobe Spark)
Overview
Adobe Creative Cloud Express, previously known as Adobe Spark, is a suite of integrated apps designed for quick content creation, including graphics, web pages, and video stories. This platform is a part of the Adobe ecosystem, which ensures high standards of design and functionality, making it a powerful tool for professionals looking to create high-quality visual content efficiently.
Key Features
Professional Templates: Adobe Creative Cloud Express offers a wide array of professionally designed templates that can be quickly adapted to any project, ensuring a high-quality finish.
Integration with Adobe Stock: Users have access to Adobe Stock images directly within the platform, providing a vast library of high-quality graphics and photos to enhance their infographics.
Advanced Design Capabilities: Leveraging Adobe’s design expertise, the platform includes advanced features like animation, video integration, and professional-grade font options.
Cross-Platform Compatibility: As part of the Adobe Creative Cloud suite, projects can be started on one device and finished on another, and users can access other Adobe tools seamlessly.
AI-Enhanced Capabilities
Content-Aware Layouts: Adobe Creative Cloud Express uses Adobe's AI, Adobe Sensei, to automatically adjust the layouts of designs based on the content added, optimizing visual impact and balance.
Quick Actions: Features like background removal and style transfer are powered by AI, allowing users to enhance their designs with just a few clicks.
Ease of Use
Despite its professional capabilities, Adobe Creative Cloud Express is designed to be accessible to users of all skill levels, including those without professional design experience. The platform’s user interface is intuitive, and extensive learning resources are provided to help users take full advantage of its features.
Applications
Marketing Content: Ideal for creating marketing materials such as social media graphics, promotional videos, and branded web pages.
Personal Projects: Users also employ Adobe Creative Cloud Express for personal projects like invitations, announcements, and photo collages due to its ease of use and flexibility.
Pricing
Free: $0.00
Premium: $4.79
Teams: $5.27
Students Premium: $4.79
Students Creative Cloud All Apps: $19.17
K-12 Education: $0.00
Non Profits: $0.00
skills.ai
Overview
Skills.ai offers a unique platform that integrates advanced artificial intelligence to help users create stunning and informative infographics. It is designed to assist marketers, educators, and business professionals who aim to communicate complex information visually and engagingly. The platform stands out for its focus on usability and integration of AI to streamline the design process and enhance the final products with smart data visualization techniques.
Key Features
AI-Driven Design Tools: Skills.ai utilizes AI algorithms to suggest design layouts, color schemes, and text placement based on the content provided by the user, optimizing the visual appeal and readability of infographics.
Data Visualization Capabilities: The platform excels in transforming raw data into clear and engaging visual formats. Users can input their data sets, and Skills.ai will automatically create charts, graphs, and other data representations.
Template Variety: Skills.ai offers a range of templates designed for various industries and content types, allowing users to start with a foundation that closely matches their needs.
Collaborative Features: Facilitating teamwork, Skills.ai provides options for real-time collaboration, enabling teams to work together seamlessly from different locations.
Ease of Use
The interface is intuitively designed to be user-friendly, catering to both novices and experienced designers. With comprehensive support and tutorials available, users can quickly learn to navigate the platform and make full use of its features.
Applications
Business Analytics: Companies use Skills.ai to create infographics that visualize sales data, customer demographics, and market trends, making complex information accessible and actionable.
Educational Content: Educators utilize the platform to produce visually engaging materials that help illustrate complex academic concepts in a more digestible format.
Pricing
Basic: $0.23
Pro: $0.35
Enterprise: $1.19+
Midjourney
Overview
Midjourney is an innovative AI tool that is less about traditional infographic creation and more about generating high-quality visual content through advanced AI. Midjourney specializes in creating detailed, artistic images from textual descriptions, providing a novel way to visualize concepts, ideas, and narratives. This tool is particularly valuable for creative professionals, marketers, and content creators looking to bring a new level of visual storytelling to their projects.
Key Features
Advanced Image Generation: Midjourney uses cutting-edge AI to generate images from textual prompts, allowing users to create visuals that are both unique and closely aligned with their specific requirements.
High Customization: Users can fine-tune their prompts and use advanced parameters to guide the AI in generating images that meet specific aesthetic and stylistic needs.
Community-Driven Development: Midjourney is built around a community of users who contribute to the platform’s development by sharing their creations and insights, fostering a collaborative environment.
Integration Capabilities: While primarily known for image generation, Midjourney can be integrated into broader design projects, adding a layer of custom visual content to traditional infographics.
Ease of Use
Midjourney challenges traditional design interfaces by operating primarily through Discord, where users interact with the AI via chat. This unique approach simplifies the user experience but may require a learning curve for those unfamiliar with Discord.
Applications
Creative Projects: Artists and designers use Midjourney to explore new creative possibilities, creating bespoke artwork that can accompany articles, presentations, and marketing materials.
Concept Visualization: Businesses and innovators use Midjourney to generate visual representations of new ideas and concepts, enhancing pitches and proposals with compelling imagery.
Appy Pie
Overview
Appy Pie is a comprehensive platform that extends beyond traditional infographic creation to encompass a broad suite of design and development tools, including app building, website creation, and graphic design. It is recognized for its no-code solutions, allowing users to create professional-quality digital products without any programming knowledge. In the context of infographics, Appy Pie offers a user-friendly graphic editor designed to make the process of infographic creation both simple and effective.
Key Features
Drag-and-Drop Editor: Appy Pie’s graphic design tool features a drag-and-drop interface that simplifies the design process. Users can easily add, move, and resize elements to create custom infographics without any prior design experience.
Rich Content Library: The platform provides a vast array of graphic elements, including icons, vectors, and photos, which can be integrated into infographics to enhance their visual appeal and effectiveness.
AI-Powered Design Assistance: Appy Pie incorporates AI technology to help users with design decisions, offering suggestions on layout, color schemes, and typography based on the content and purpose of the infographic.
Multi-Platform Functionality: As part of Appy Pie’s suite, users can create not only infographics but also matching designs for websites, apps, and more, ensuring brand consistency across all platforms.
Ease of Use
Appy Pie prioritizes accessibility, with tools designed to be intuitive and straightforward. The platform also offers extensive support and learning resources, including tutorials and a responsive customer service team.
Applications
Marketing and Business: Small businesses and marketers use Appy Pie to create engaging infographics that summarize services, showcase products, or present market data.
Education: Educators and students find Appy Pie useful for creating visual aids and learning materials that help simplify complex subjects.
Pricing
Basic: $83.94/app/year
Gold: $119.97/app/year
Platinum: $192.03/app/year
Infographic Ninja
Overview
Infographic Ninja is a specialized tool focused exclusively on infographic creation. It targets users looking to convert complex data and text into clear and engaging visual formats. This tool is particularly valued for its simplicity and the efficiency with which it allows users to create professional-looking infographics.
Key Features
Template-Driven Design: Infographic Ninja offers a variety of templates that users can customize to fit their specific needs. These templates are designed to accommodate various types of information and data presentation.
Interactive Elements: The tool allows the inclusion of interactive elements in infographics, such as hyperlinks and embedded widgets, which can make the final products more engaging and informative.
AI-Enhanced Customization: Leveraging AI, Infographic Ninja provides users with automated suggestions for layout adjustments and content placement to optimize the visual impact of their infographics.
Social Media Integration: Users can directly share their completed infographics on social media platforms or embed them on websites, enhancing the reach and applicability of their creations.
Ease of Use
Infographic Ninja is designed to be user-friendly, with a focus on helping users achieve professional results without needing advanced design skills. The platform's interface is straightforward, allowing for quick learning and effective use.
Applications
Content Marketing: Digital marketers utilize Infographic Ninja to create compelling visuals that attract social media engagement and enhance blog posts.
Reports and Presentations: Businesses and academic users employ the tool to generate informative visuals that summarize research findings or business analytics.
Pricing
Starter- 15 Credits $5.00 per month.
Lite- 100 Credits $15.00 per month.
Pro- Unlimited Credits $30.00 per month.
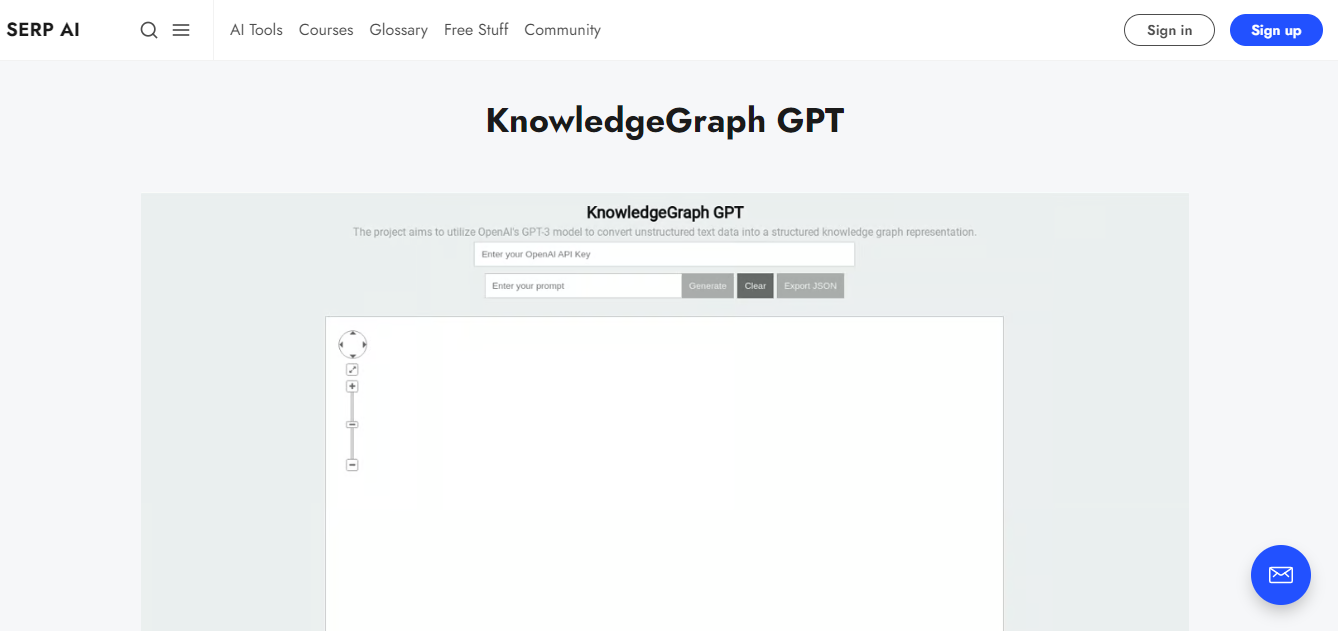
Knowledge Graph GPT
Overview
Knowledge Graph GPT is a specialized tool designed to transform unstructured text data into structured knowledge graphs using OpenAI’s GPT models. This unique application caters primarily to researchers, data analysts, and professionals in fields that require the organization of large amounts of information into clear, manageable formats. It stands out for its ability to automate the extraction of insights from text, thereby facilitating a more effective way to visualize relationships and data points in a network form.
Key Features
Advanced Text Analysis: Leveraging the capabilities of GPT, Knowledge Graph GPT can parse through extensive text and identify key entities and their relationships, converting these into visual knowledge graphs.
Ease of Data Integration: The tool can handle data from various sources, including academic papers, reports, and web content, making it versatile across different contexts.
Interactive Graphs: The generated knowledge graphs are interactive, allowing users to explore different nodes and connections in detail, which enhances understanding and analysis.
Export Options: Users can export the generated graphs in several formats, which facilitates sharing and further analysis in other software or presentations.
Ease of Use
Despite its sophisticated backend, Knowledge Graph GPT is designed with a user-friendly interface that allows users without technical expertise in data science to generate and utilize knowledge graphs effectively.
Applications
Academic Research: Scholars use Knowledge Graph GPT to analyze literature and extract key themes and relationships, aiding in literature reviews and research design.
Market Analysis: Analysts employ this tool to understand market trends and relationships between various industry players through analysis of reports and news articles.
Scripted
Overview
Scripted is a content creation platform that combines the talents of human writers with AI-driven processes to produce high-quality written content, including content for infographics. It is particularly valued by marketers, bloggers, and businesses that require consistent and engaging content across various platforms. Scripted provides a unique solution where AI tools assist in generating initial drafts or outlines, which are then refined by professional writers to ensure accuracy and creativity.
Key Features
Hybrid Content Creation: Scripted offers a hybrid model where AI-generated content is reviewed and enhanced by human experts, ensuring high-quality output that resonates with human audiences.
Customizable Content Requests: Users can request specific types of content, including detailed outlines or textual content for infographics, tailored to their exact needs.
SEO Optimization: The platform ensures that all content is optimized for search engines, incorporating keywords effectively and adhering to best SEO practices.
Scalability: Scripted can handle large volumes of content requests, making it suitable for companies looking to scale their content marketing efforts without compromising quality.
Ease of Use
Scripted is straightforward to use, with a clear interface that allows users to place orders, specify requirements, and receive content in a streamlined manner.
Applications
Content Marketing: Businesses use Scripted to generate engaging blog posts, articles, and social media content that drives traffic and engagement.
Infographic Content: Marketers leverage the platform to get textual content that is specifically crafted to be visualized in infographics, enhancing the effectiveness of visual marketing strategies.
Pricing
Starter- $0/month
Pro- $199/month
Team- $499/month
Enterprise & Agency- Customized plan
Design Shifu
Overview
Design Shifu offers a subscription-based graphic design service that focuses on creating custom graphics, including infographics, for a variety of business needs. With a strong emphasis on affordability and quick turnaround times, Design Shifu positions itself as an ideal partner for small businesses, startups, and marketers looking for consistent and professional visual content without the overhead of an in-house design team.
Key Features
Unlimited Requests and Revisions: Subscribers to Design Shifu can request as many designs as they need, with the option for unlimited revisions, ensuring complete satisfaction with the final product.
Dedicated Graphic Designers: Clients are matched with skilled graphic designers who work to understand and adapt to the specific branding and design needs of each business, providing personalized service.
Wide Range of Design Services: Beyond infographics, Design Shifu handles a variety of design tasks, including social media graphics, website banners, and marketing materials, making it a versatile option for ongoing design needs.
Quick Turnaround: The service promises fast delivery times, typically providing initial designs within a couple of days, which is crucial for businesses operating on tight schedules.
Ease of Use
Design Shifu simplifies the design process by handling project management and designer coordination, allowing clients to focus on their core business activities. Clients interact with designers through a straightforward digital platform, submitting and reviewing design requests easily.
Applications
Marketing Campaigns: Companies frequently use Design Shifu to create eye-catching infographics that distill complex information into digestible visuals, enhancing their marketing campaigns.
Content Enhancement: Blogs and websites utilize the service to obtain custom graphics that complement their written content, improving reader engagement and SEO.
Pricing
Limited- $199/month
Unlimited- $399/month
Unlimited Plus- $599/month
Animaker
Overview
Animaker is an online DIY animation software that enables users to create animated videos, including animated infographics, without the need for complex software or professional animation skills. It stands out for its user-friendly interface and rich set of features that cater to non-designers looking to create professional-level animations.
Key Features
Extensive Asset Library: Animaker boasts a vast library of animated characters, properties, backgrounds, and sound effects, which users can drag and drop into their projects.
Infographic Animation Tools: The platform includes specific tools and templates for creating animated infographics, allowing for dynamic presentations of data that are more engaging than static images.
Voiceover Integration: Users can add voiceovers to their animations directly within the platform, enhancing the narrative quality of their infographics.
Multi-User Collaboration: Animaker supports collaboration, enabling team members to work together in real-time on projects, which is ideal for businesses and educational groups.
Ease of Use
Animaker’s interface is designed to be intuitive, with a gentle learning curve. It offers tutorials and guides to help new users get started quickly, making sophisticated animation accessible to everyone.
Applications
Educational Content: Educators and students use Animaker to create animated videos that explain complex subjects in a visually engaging way.
Marketing and Explainer Videos: Businesses utilize Animaker to produce explainer videos that incorporate animated infographics, making technical or dense information more accessible to their audience.
Pricing
Basic- $12.5/month
Starter- $25/month
Pro- $39/month
Enterprise- Custom Pricing
Biteable
Overview
Biteable stands out as a prominent online video maker that allows users to create stunning, professionally-styled videos, including video infographics. It is particularly renowned for its ease of use, making powerful video creation accessible to users without prior video production experience. Biteable is ideal for businesses, educators, and marketers who wish to communicate their messages effectively through engaging video content.
Key Features
Extensive Template Library: Biteable offers a broad selection of pre-designed templates that cater to various themes and industries. These templates provide a strong starting point for creating video infographics, promotional videos, social media clips, and more.
Customization Options: Users can easily customize their videos with text, colors, and music to match their brand identity or personal style preferences. The platform provides a range of editing tools that make these adjustments straightforward.
Rich Media Library: The platform includes thousands of clips, animations, and images, which can be used to enhance video infographics. This media library helps users create videos that are not only informative but also visually appealing.
HD Quality Video Production: Biteable allows users to produce videos in HD quality, ensuring that the final products are clear and professional. This feature is particularly important for businesses that need high-quality content for presentations or marketing campaigns.
Ease of Use
Biteable is designed with a focus on user-friendliness. Its interface is intuitive, with drag-and-drop functionalities that simplify the video creation process. New users can quickly get up to speed with minimal learning curve thanks to helpful tutorials and responsive customer support.
Applications
Marketing and Advertising: Companies use Biteable to create compelling video ads and marketing materials that can be shared on television or across social media platforms.
Educational Purposes: Educators and trainers find Biteable useful for creating instructional videos that make complex subjects easier to understand through dynamic visuals and storytelling.
Corporate Communication: Biteable is also used for internal communications, helping to make company updates, reports, and presentations more engaging for team members.
Pricing
Pro- $99/month
Premium- $199/month
Business- Custom Pricing
What Is An AI Infographic Generator?
An AI infographic generator is a powerful tool designed to simplify and enhance the creation of infographics, leveraging artificial intelligence to automate design tasks and data visualization. These tools transform complex data and text into visually appealing and easy-to-understand graphics, making them ideal for marketers, educators, businesses, and anyone looking to convey information effectively.
Key Features of AI Infographic Generators:
Generative AI Capabilities: Many AI infographic generators, such as Canva, Piktochart, and Visme, use advanced AI to generate stunning visuals from text inputs. This includes automatic layout arrangement, color matching, and incorporating dynamic elements like charts and icons.
User-Friendly Interfaces: Platforms like Snappa and Infogram offer drag-and-drop interfaces, making it easy for users of all skill levels to create professional-grade infographics without prior design experience.
Customization and Flexibility: Users can customize templates, adjust design elements, and even integrate their own data. This customization is supported by tools like Midjourney and Appy Pie, which provide extensive template libraries and editing options.
Integration with Other Platforms: Many AI infographic tools integrate with stock photo libraries and data sources, allowing users to seamlessly add professional images and up-to-date data into their designs.
Versatility and Accessibility: From educational materials to marketing campaigns, AI infographic generators are versatile enough to cater to a variety of design needs. Platforms like Adobe Creative Cloud Express and Infographic Ninja support a range of formats and types, including animated and static infographics.
These tools not only facilitate the quick creation of eye-catching and informative infographics but also ensure that the designs are aligned with the latest trends in digital marketing and visual communication. By automating many of the tedious aspects of graphic design, AI infographic generators empower users to focus more on content and strategy, enhancing the overall impact of their information dissemination.
How does AI Banner Infographic work?
AI banner infographic generators represent a cutting-edge intersection of artificial intelligence and graphic design, tailored specifically to automate and enhance the creation of visually engaging banner infographics. These tools employ sophisticated algorithms to interpret textual content and convert it into compelling infographic designs, streamlining the design process for users of all skill levels.
Text-to-Infographic Conversion: At the core of AI banner infographic tools, such as Canva, Visme, and Infogram, lies the ability to automatically convert textual input into a graphical format. This process involves analyzing the text to extract key points and visually represent them through icons, charts, and layouts.
Template-Based Design: Most AI infographic generators provide a wealth of customizable templates. These templates serve as a starting point, allowing users to select a design that best fits their content. From there, AI elements adjust the layout and style based on the inputted data, ensuring that the infographic remains both informative and aesthetically pleasing.
Automated Design Elements: Utilizing AI, these tools can automatically suggest design elements such as color schemes and font styles that align with the content's tone and context. This capability is particularly evident in platforms like Snappa and Adobe Creative Cloud Express, which integrate AI to enhance user-friendliness and design coherence.
Integration with Data Sources: Advanced AI infographic generators integrate seamlessly with external data sources, enabling users to incorporate real-time data into their designs. This is particularly useful for banners that require up-to-date information, such as statistical infographics or business reports.
Drag-and-Drop Interfaces: Even with advanced AI capabilities, the simplicity of the user interface remains a priority. Tools like Piktochart and Venngage emphasize drag-and-drop functionality, allowing users to intuitively place and edit design elements without needing extensive design knowledge.
Scalability and Customization: AI-driven tools are designed to scale with the user’s needs. Whether creating a simple banner for a blog post or a detailed infographic for a corporate presentation, these tools can adjust complexity based on the project requirements.
What Are The Benefits Of An AI Infographic Generator?
AI infographic generators have revolutionized the way visuals are created in the digital age, offering a blend of creativity and automation to produce engaging and informative graphics. These tools are equipped with capabilities that cater to various needs, from marketing campaigns to educational content, making them invaluable in diverse sectors. Here, we explore the significant benefits of using an AI infographic generator, utilizing examples from leading tools mentioned in resources like Penji, Design Shifu, Skills.ai, and GeeksforGeeks.
1. Time and Efficiency:
One of the primary advantages of using an AI infographic generator is the significant reduction in time and effort required to create complex visuals. Traditional graphic design can be time-consuming, involving various stages from concept to execution. AI generators like Canva and Visme automate many of these processes, allowing users to produce polished infographics quickly. This efficiency is particularly beneficial for businesses and content creators who need to deliver high-quality content consistently and on tight schedules.
2. No Design Skills Required:
AI infographic generators democratize design by making it accessible to everyone, regardless of their graphic design skills. Platforms such as Piktochart and Venngage offer user-friendly interfaces and drag-and-drop features that simplify the design process. Users can select from a range of templates, which the AI then customizes based on the provided content. This feature is a boon for non-designers who want to create professional-looking infographics without undergoing extensive design training.
3. Consistency and Brand Alignment:
Maintaining brand consistency across all visual content can be challenging, especially for organizations with extensive marketing needs. AI infographic generators help ensure that every infographic adheres to the company’s brand guidelines. Tools like Adobe Creative Cloud Express provide options to incorporate brand colors, fonts, and logos seamlessly, reinforcing brand identity across all communications.
4. Access to Advanced Analytics and Data Integration:
Modern AI infographic tools integrate advanced analytics and the ability to pull data directly from various sources, such as Excel spreadsheets or web analytics. Infogram and similar tools excel in transforming raw data into visually appealing and digestible formats, making them indispensable for data-driven organizations. This integration facilitates real-time data updates in infographics, ideal for dynamic content like annual reports or performance dashboards.
5. Cost-Effective:
Investing in traditional graphic design services or software can be expensive, particularly for small businesses or individual bloggers. Many AI infographic generators offer free versions or cost-effective plans that provide powerful design tools and resources at a fraction of the cost. This accessibility allows even the smallest entities to compete on the same visual playing field as larger organizations.
6. Enhanced Engagement and Communication:
Infographics created with AI are designed to be engaging and informative, helping to convey complex information in an easily digestible format. This visual appeal is crucial in capturing and retaining the audience's attention, particularly in a digital landscape saturated with content. Effective use of visual data and design elements can significantly enhance message retention and audience engagement, leading to better communication outcomes.
7. Scalability and Versatility:
AI infographic generators are scalable and versatile, capable of handling everything from small one-off projects to large-scale campaigns. Whether for social media posts, educational materials, or corporate presentations, these tools can adapt to various content needs and styles, providing consistent quality and design.
What To Look For In An AI Infographic Generator?
Choosing the right AI infographic generator can significantly impact the effectiveness and efficiency of your content creation process. With a plethora of tools available, such as those featured on Penji, Design Shifu, Skills.ai, and GeeksforGeeks, it’s essential to know the key features and functionalities that can make a tool stand out. Here’s what to look for when selecting an AI infographic generator to ensure you get the best tool for your needs:
1. Ease of Use and User Interface:
The primary appeal of an AI infographic generator lies in its ease of use. Look for tools that offer a clean, intuitive user interface and straightforward navigation. This feature is crucial for users who are not professional designers and need a hassle-free experience. Platforms like Canva and Piktochart are renowned for their user-friendly design, enabling quick learning and efficient use without extensive training.
2. Quality and Variety of Templates:
A robust library of templates is essential for creating diverse and visually appealing infographics quickly. The best AI infographic generator should offer a wide range of customizable templates that can cater to various industries and content types. This variety allows users to maintain freshness in their visuals and adapt designs to different messages and audiences effectively.
3. Customization Capabilities:
While templates provide a good starting point, customization is key to creating unique and impactful infographics. Ensure that the AI tool allows for easy customization of colors, fonts, and layouts to align with your brand’s identity. Tools like Adobe Creative Cloud Express and Visme offer extensive customization options, allowing for detailed modifications that can make your infographics truly one-of-a-kind.
4. Integration with Data Sources:
For infographics that require data visualization, the ability to integrate seamlessly with external data sources like Excel files or web APIs is invaluable. This feature saves time and enhances accuracy by pulling data directly into the infographic. Look for generators like Infogram and Visme that excel in data integration and provide dynamic data visualization capabilities.
5. Rich Media Support:
The inclusion of rich media elements like images, icons, and videos can significantly enhance the appeal of your infographics. An excellent AI infographic generator will provide access to a vast library of stock photos, icons, and media files, as well as the ability to upload your own. Tools like Snappa and Canva offer extensive libraries of free and premium media assets.
6. Scalability and Performance:
Consider the scalability of the tool, especially if you plan to create high volumes of infographics or need to support a team of users. The software should be able to handle increased demands without compromising on speed or quality. Look for platforms that offer team collaboration features and cloud-based performance, ensuring that your tool grows with your needs.
7. Pricing and Value for Money:
Evaluate the pricing structure of the AI infographic generator. Many tools offer a basic free version, which might be sufficient for occasional users or small projects. However, for more advanced features, you’ll likely need to consider paid plans. Assess whether the pricing tiers provide good value for the features and capabilities offered. Free trials or demos are a great way to test a tool before committing financially.
8. Export and Sharing Options:
Finally, check the export options available. It’s essential that the tool supports various file formats like PNG, JPG, SVG, or PDF to ensure compatibility across different platforms and uses. Additionally, direct sharing capabilities to social media platforms or the ability to embed infographics on websites can greatly enhance workflow efficiency.
How To Use An AI Infographic Generator?
Using an AI infographic generator is a straightforward process that can greatly enhance your ability to communicate complex information through visually appealing graphics. These tools are designed to be accessible, regardless of your design expertise, and offer a quick way to produce professional-quality infographics. Below, we outline a step-by-step guide on how to use an AI infographic generator, drawing on features from platforms highlighted in resources such as Penji, Design Shifu, Skills.ai, and GeeksforGeeks.
Step 1: Choose the Right AI Infographic Generator
Start by selecting an AI infographic generator that best suits your needs. Consider factors like ease of use, template variety, customization options, and integration capabilities. Platforms like Canva, Visme, and Adobe Creative Cloud Express are popular choices that offer a range of features from basic to advanced levels, catering to both free and premium users.
Step 2: Set Up Your Account
Most AI infographic generators require you to create an account. This process typically involves providing your email address and setting up a password. Some platforms might also offer the option to sign in using social media credentials, which can streamline the setup process.
Step 3: Select a Template
Once you’ve logged in, start your infographic creation by choosing a template. Good AI infographic generators offer a wide selection of templates that are categorized by type, such as educational, business, marketing, etc. These templates are designed to be a starting point, providing a basic layout and design that you can customize further.
Step 4: Customize Your Infographic
After selecting a template, customize it to fit your specific needs. This is where AI capabilities really shine. You can input your data, and the tool will suggest the best ways to display this information visually. You can adjust various elements such as:
Text: Add headings, subheadings, and body text.
Colors and Fonts: Change the color schemes and fonts to match your brand or preference.
Graphics: Insert icons, charts, and images from the tool’s library or upload your own.
Layouts: Rearrange elements to better fit your content or to emphasize key points.
Step 5: Incorporate Data
For infographics that require data visualization, input the necessary data. Some AI tools allow you to import data directly from spreadsheets or connect to live data sources. The AI will automatically create charts and graphs based on this data, which you can fine-tune according to your preferences.
Step 6: Review and Edit
Review your infographic to ensure all information is accurate and displayed effectively. The AI tool may also provide suggestions for improvement—take advantage of these AI-driven insights to optimize your design.
Step 7: Export and Share
Once your infographic is complete, export it in the desired format. Common formats include PNG, JPEG, or PDF. Check if your chosen tool also offers specific options for sharing directly on social media platforms or embedding in websites, which can save time and enhance presentation.
Step 8: Analyze Feedback and Iterate
After publishing your infographic, gather feedback to see how it performs. Many platforms offer analytics to track engagement. Use this information to refine future infographics, learning what works best for your audience.
Sample Prompts For An AI Infographic Generator
Creating compelling infographics requires not only great design but also a clear understanding of the content that needs to be communicated. AI infographic generators, such as those mentioned in resources from Penji, Design Shifu, Skills.ai, and GeeksforGeeks, simplify this process by providing tools that convert textual data into visually engaging graphics. To help you get started, here are sample prompts that you can use with an AI infographic generator. These prompts are tailored to different scenarios and include the necessary keywords to maximize the utility of AI tools in infographic creation.
1. Business Growth Metrics Over Five Years
Prompt: "Generate an infographic displaying key business growth metrics over the past five years including revenue, profit margins, and employee headcount. Highlight year-over-year changes with a clear, visually engaging trendline."
2. Health Benefits of Daily Exercise
Prompt: "Create an infographic summarizing the health benefits of daily exercise, focusing on improvements in heart health, weight management, and mental well-being. Use icons and statistics to visualize the impact of exercise on overall health."
3. Impact of Renewable Energy Adoption
Prompt: "Illustrate the global impact of renewable energy adoption on reducing carbon emissions from 2010 to 2020. Include a graph showing the percentage decrease in emissions and the increase in renewable energy usage."
4. Social Media Trends for Small Businesses in 2023
Prompt: "Design an infographic detailing the top social media trends for small businesses in 2023. Include data on the most effective platforms for engagement, trends in consumer behavior, and tips for content strategy."
5. Educational Achievements by Region
Prompt: "Develop an infographic that compares educational achievements across different regions. Display metrics such as graduation rates, literacy levels, and educational funding per student in a comparative format."
6. Coffee Consumption Statistics
Prompt: "Produce an infographic that shows statistics about coffee consumption in major cities around the world. Highlight the average cups per day, preferred types of coffee, and demographic data of coffee drinkers."
7. Guide to Recycling Plastics
Prompt: "Generate an infographic that serves as a guide to recycling plastics. Use icons to represent different types of plastics, and include a flowchart showing the recycling process from collection to reuse."
8. Advancements in Electric Vehicles
Prompt: "Create an infographic outlining the advancements in electric vehicles (EVs) technology from 2015 to 2025. Include milestones in battery technology, range improvements, and market adoption rates."
Explore These Unmatched AI Tools
- 11 Best AI Banner Generators Reviewed
- 11 AI Dialogue Generators to Write Brilliant Script
- 10 Best AI Newsletter Generators to Win at Email Marketing
- Top 15 AI Letter of Recommendation Generators
- 14 Best AI Review Generators
- 18 Best AI Affiliate Programs in 2024
Conclusion
AI infographic generators are transforming the landscape of visual communication, blending innovative AI technology with user-friendly design tools to streamline the process of creating compelling and informative graphics. These tools, exemplified by platforms like Canva, Visme, and Piktochart, not only automate the tedious aspects of design but also provide powerful customization and integration options that cater to a diverse range of needs—from marketing campaigns to educational content.
By harnessing the power of AI, these generators help users efficiently produce visuals that are not only eye-catching but also strategically optimized for engagement and SEO. The benefits of using such tools are clear: they save time, enhance consistency, provide scalability, and open up graphic design to a broader audience irrespective of their technical skills.
Whether you are a professional designer looking to expedite your workflow, a marketer aiming to captivate your audience with striking visuals, or an educator seeking to distill complex information into digestible infographics, AI infographic generators offer a versatile and invaluable resource. As the digital landscape continues to evolve, these tools will play a pivotal role in enabling effective and innovative visual communication.
Frequently Asked Questions (FAQs)
How secure are AI infographic generators with sensitive data?
AI infographic generators like Canva and Visme prioritize data security by using encryption and secure cloud services to ensure that all user data, including sensitive information, is well protected during both transmission and storage.
Can AI infographic generators handle multiple languages for global teams?
Yes, many AI infographic generators support multiple languages, allowing global teams to create content in various languages. Platforms like Canva and Adobe Creative Cloud Express offer multilingual support to cater to diverse user bases.
Are there any AI infographic generators specifically tailored for mobile devices?
Many AI infographic generators, including Canva and Adobe Creative Cloud Express, offer mobile apps that allow users to create, edit, and share infographics directly from their smartphones or tablets, providing flexibility to design on the go.